Streamlit example: Montreal monthly bicycle counts
- 9 minutes
- streamlit, python, montreal, cycling
Streamlit is an open source framework for quickly creating apps and data visualizations from python. Start from a python script, add some interaction widgets, and you get a nice looking app that you can share quite easily.
I wanted to try Streamlit for a while, and I knew I needed some data to play with. I live in Montreal, so I went to their open data web site and I found a bicycle counts dataset. I recently started winter cycling, and I often wondered what proportion of summer cyclists were also going out during the winter.
The final application is deployed on heroku and the code repository is on github.
Using Streamlit
Streamlit’s general idea is to take a python script and turning it into an app. It comes with very good integrations and tools to make this process quite enjoyable.
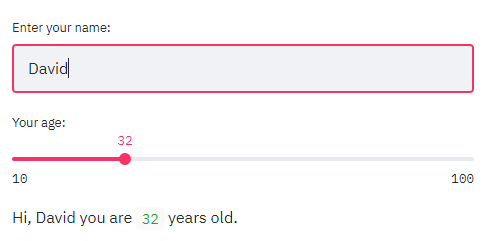
The expected inputs are available, to get information from the user:
import streamlit as st

name = st.text_input("Enter your name:")
age = st.slider("Your age:", min_value=10, max_value=100)

st.write(f"Hi, ", name, " you are ", age, "years old.")
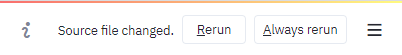
While writing your script, you will notice a very useful feature: the automatic refresh. When you save your script, the server notices the files changed and reloads itself:
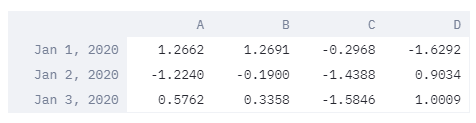
To display data, the simplest method is st.write(), which will use a different widget depending on the type of the value it’s given.
Here is a simple example with a pandas DataFrame:
import streamlit as st
import pandas as pd
import numpy as np

dates = pd.date_range("20200101", periods=3)
df = pd.DataFrame(np.random.randn(3, 4), index=dates, columns=list("ABCD"))

st.write(df)
Working with data in Streamlit
When you run streamlit run your-file.py, the script is executed from top to bottom every time an input is received from the user. This will quickly get problematic if you fetch data over the internet, or perform long computations. Streamlit uses caching to solve this issue. The @st.cache() decorator will keep a function’s returned value in memory and return it immediately on the next run. Everytime the code or the arguments of the function changes, another cache object gets loaded, ready to be fetched at the next iteration. This simple concept is very powerful.
If you’re familiar with Jupyter notebooks, this kind of data exploration and visualization will certainly be familiar to you. There is an important distinction between Streamlit and Jupyter notebooks: the hidden state. In Jupyter, while you are exploring a dataset, you must always keep in mind the state of your python interpreter (which variables are loaded in memory). This becomes confusing when this state doesn’t correspond with the order of the cells. You can see an explanation in Joel Grus’ entertaining presentation slides. I don’t believe that Streamlit’s goal is to replace Jupyter notebooks. I’m sure both will keep beeing very popular for slightly different use cases.
Actually, the data flow in Streamlit reminded me more of React in a way. The widgets are identified internally by a unique key, and are only regenerated when they need to be. More on that later.
Getting the bicycle counts data
With some standard pandas functions, we can create the cached function for getting and parsing the bicycle counts datasets:
@st.cache()
def get_data():
    """Get and parse the bicycle counts data"""

    counter_locations_url = "http://donnees.ville.montreal.qc.ca/dataset/f170fecc-18db-44bc-b4fe-5b0b6d2c7297/resource/c7d0546a-a218-479e-bc9f-ce8f13ca972c/download/localisationcompteursvelo2015.csv"
    bicycle_counts_urls = {
        2018: "http://donnees.ville.montreal.qc.ca/dataset/f170fecc-18db-44bc-b4fe-5b0b6d2c7297/resource/eea2434f-32b3-4dc5-9035-f1642509f0e7/download/comptage_velo_2018.csv",
        2017: "http://donnees.ville.montreal.qc.ca/dataset/f170fecc-18db-44bc-b4fe-5b0b6d2c7297/resource/83063700-8fe7-4e6f-8c4b-ed55f4602514/download/comptagevelo2017.csv",
        2016: "http://donnees.ville.montreal.qc.ca/dataset/f170fecc-18db-44bc-b4fe-5b0b6d2c7297/resource/6caecdd0-e5ac-48c1-a0cc-5b537936d5f6/download/comptagevelo20162.csv",
        2015: "http://donnees.ville.montreal.qc.ca/dataset/f170fecc-18db-44bc-b4fe-5b0b6d2c7297/resource/64c26fd3-0bdf-45f8-92c6-715a9c852a7b/download/comptagevelo20152.csv",
        # 2014: "http://donnees.ville.montreal.qc.ca/dataset/f170fecc-18db-44bc-b4fe-5b0b6d2c7297/resource/868b4bc8-ff55-4c48-ab3b-d80615445595/download/comptagevelo2014.csv",
        # 2013: "http://donnees.ville.montreal.qc.ca/dataset/f170fecc-18db-44bc-b4fe-5b0b6d2c7297/resource/ec12447d-6b2a-45d0-b0e7-fd69c382e368/download/comptagevelo2013.csv",
        # 2012: "http://donnees.ville.montreal.qc.ca/dataset/f170fecc-18db-44bc-b4fe-5b0b6d2c7297/resource/d54cec49-349e-47af-b152-7740056d7311/download/comptagevelo2012.csv",
        # 2011: "http://donnees.ville.montreal.qc.ca/dataset/f170fecc-18db-44bc-b4fe-5b0b6d2c7297/resource/f2e43419-ebb2-4e38-80b6-0644c8344338/download/comptagevelo2011.csv",
        # 2010: "http://donnees.ville.montreal.qc.ca/dataset/f170fecc-18db-44bc-b4fe-5b0b6d2c7297/resource/f23e1c88-cd04-467f-a64a-48f5eb1b6c9e/download/comptagevelo2010.csv",
        # 2009: "http://donnees.ville.montreal.qc.ca/dataset/f170fecc-18db-44bc-b4fe-5b0b6d2c7297/resource/ee1e9541-939d-429e-919a-8ab94527773c/download/comptagevelo2009.csv",
    }

    # load the counter locations
    counter_locations = pd.read_csv(counter_locations_url, encoding="latin1")
    counter_locations = counter_locations.rename(
        columns={"coord_X": "lon", "coord_Y": "lat"}
    )

    # load the bicycle counts data, and sort it by date
    bicycle_counts = pd.concat(
        [
            pd.read_csv(url, encoding="utf8", parse_dates=["Date"], index_col=0)
            for url in bicycle_counts_urls.values()
        ],
        sort=True,
    ).sort_index()

    # drop unnamed columns
    bicycle_counts = bicycle_counts.loc[
        :, ~bicycle_counts.columns.str.contains("^Unnamed")
    ]

    # sort our data by the name of the counter
    counter_locations = (
        counter_locations.drop("id", axis=1)
        .sort_values(by=["nom_comptage"])
        .reset_index(drop=True)
    )

    # some counter names don't correspond between counter locations and count data
    renames = {
        "Brebeuf": "Brébeuf",
        "CSC": "CSC (Côte Sainte-Catherine)",
        "Parc U-Zelt Test": "Parc",
        "Pont_Jacques-Cartier": "Pont Jacques-Cartier",
        "Rachel/Hôtel de Ville": "Rachel / Hôtel de Ville",
        "Rachel/Papineau": "Rachel / Papineau",
        "Saint-Laurent U-Zelt Test": "Saint-Laurent/Bellechasse",
        "Totem_Laurier": "Eco-Totem - Métro Laurier",
    }

    counts_df = pd.DataFrame(
        {
            "lat": counter_locations.lat,
            "lon": counter_locations.lon,
            "name": counter_locations.nom_comptage.map(
                lambda name: renames.get(name, name)
            ),
            "nom": counter_locations.nom,
        }
    )

    return counts_df, bicycle_counts
The first time this functions is called, the urls will be fetched, but the second time, we will get the parsed DataFrames directly.
One important limitation of the caching mechanism is that the output must not be modified directly. The data kept in memory will be exactly the one you get back when the script runs again, so your code will try to modify it again, which is most likely not what you want. Streamlit will warn you if you try to do that.
counts_df, bicycle_counts = get_data()

# don't modify the outputs from a cached streamlit function
counts_df = counts_df.copy()
Note that you don’t need to copy the outputs every time. I do it here, because I want to modify this DataFrame later.
Next, we resample our daily data to a monthly mean, and prepare the presentation widgets. Notice I used the st.empty() placeholder that will be filled later in the script. This was necessary to add the animations.
# resample daily data to monthly means
bicycle_counts = bicycle_counts.resample("M").mean()

years_months_values = [(d.year, d.month) for d in bicycle_counts.index]
year, month = years_months_values[0]

# Setup presentation widgets
st.header("Visualization of bicycle counts in Montreal, Qc")
date_value = st.empty()
month_slider = st.empty()
st.subheader("Animation")
animations = {"None": None, "Slow": 0.4, "Medium": 0.2, "Fast": 0.05}
animate = st.radio("", options=list(animations.keys()), index=2)
animation_speed = animations[animate]
deck_map = st.empty()
Animating with Streamlit
Creating animations in Streamlit requires a bit more reasoning. There are only 2 animated widgets in our app: the date slider and the map. I created a function for each (render_slider and render_map respectively), and we will call this function differently depending on the value of the animation_speed variable.
While creating this animation, the biggest problem I ran into is understanding the key attribute for Streamlit elements. When we don’t provide any key, a key is generated for us internally, depending on the content of the widget. In the same script run, multiple widgets of the same type cannot share the same key, or we get an error.
In our case, because we are using time.sleep, the animation loops in the same script run, and the slider widget gets re-created at every frame of our animation. If we let streamlit compute the key for the slider internally, the script crashes when the slider restarts to the beginning (the same value is encountered again). To circumvent this, we can give a random key to st.slider() only when we are in an animation.
def render_slider(year, month):
    key = random.random() if animation_speed else None

    month_value = month_slider.slider(
        "",
        min_value=0,
        max_value=len(years_months_values),
        value=years_months_values.index((year, month)),
        format="",
        key=key,
    )
    year, month = years_months_values[month_value]
    d = date(year, month, 1)
    date_value.subheader(f"Month: {d:%Y}-{d:%m}")
    return year, month


def render_map(year, month):
    mask = (bicycle_counts.index.year == year) & (bicycle_counts.index.month == month)
    month_counts = bicycle_counts[mask].transpose().reset_index()
    month_counts.rename(
        columns={
            month_counts.columns[0]: "name",
            month_counts.columns[1]: "month_counts",
        },
        inplace=True,
    )

    counts_df["counts"] = counts_df.merge(
        month_counts, left_on="name", right_on="name"
    )["month_counts"]

    display_counts = counts_df[~pd.isna(counts_df["counts"])]
    deck_map.pydeck_chart(
        pydeck.Deck(
            map_style="mapbox://styles/mapbox/light-v9",
            initial_view_state=pydeck.ViewState(
                latitude=display_counts.lat.mean(),
                longitude=display_counts.lon.mean(),
                zoom=11.5,
                pitch=50,
            ),
            layers=[
                pydeck.Layer(
                    "ColumnLayer",
                    data=display_counts,
                    disk_resolution=12,
                    radius=130,
                    elevation_scale=1,
                    get_position="[lon, lat]",
                    get_color="[40, counts / 5000 * 255, 40, 150]",
                    get_elevation="[counts]",
                ),
            ],
        )
    )


if animation_speed:
    for year, month in cycle(years_months_values):
        time.sleep(animation_speed)
        render_slider(year, month)
        render_map(year, month)
else:
    year, month = render_slider(year, month)
    render_map(year, month)
Notice how Streamlit integrates perfectly with the pydeck library for displaying maps. If you run this script locally, you will need to provide your MapBox token through the mapbox.token configuration parameter.
Deploying your application
You can deploy a Streamlit app the same way you deploy a standard python web application. I used Heroku, having tried it only once 5 years ago, and the process was very smooth. Following their python guide, I added 3 small files to my repo:
Procfile
# Procfile
web: sh setup.sh && streamlit run bicycles.py
setup.sh
#!/bin/bash

mkdir -p ~/.streamlit/

cat <<EOF > ~/.streamlit/config.toml
[server]
headless = true
enableCORS = false
port = $PORT
EOF
requirements.txt
streamlit
I pointed Heroku to my GitHub repo, and there you go.
That’s it! I hope you enjoyed this quick demonstration of Streamlit’s capabilities. I certainly hope to use Streamlit in a bigger project. I encourage you to read the documentation, and you can also exchange in their discussion board.